In December 2024 a group of people will go to Antarctica bringing along 3 flat earthers. This is to test the flat earth claim that there is never a 24 hour circling sun in Antarctica. This is a collection of the different predictions for both Flat Earth and Globe.
The location is Union Glacier Camp, 79°46′05″S 83°15′42″W. This is -79.768056, -83.261667.
Flat Earth Predictions
- The sun will set
- Heading: unknown
- Time: unknown
Globe Predictions
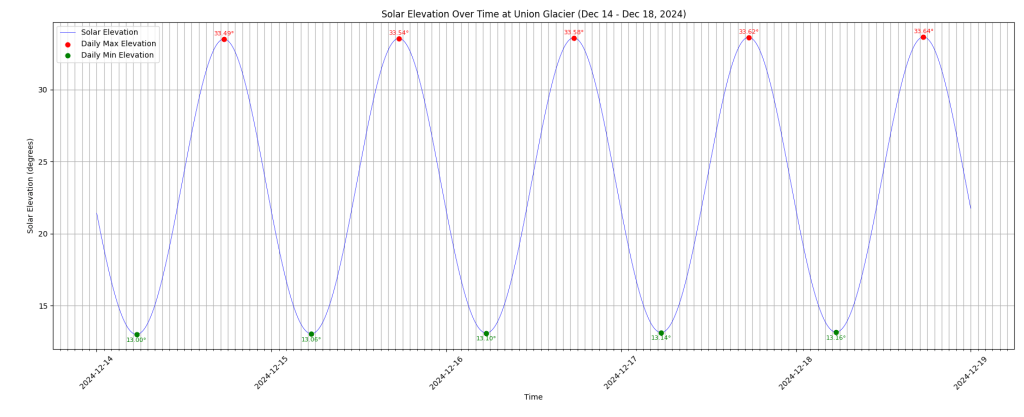
- The sun will not set, it will circle the observers 24 hours a day due north at local solar noon, and due south at local solar midnight
- Specific sun elevation predictions
- December 14 02:27:47: 13° 4′ Due South
- December 14 08:45:42: 23° 41′ Due East
- December 14 14:28:01: 33° 31′ Due North
- December 14 20:10:19: 23° 42′ Due West
- December 15 02:28:16: 13° 8′ Due South
- December 15 08:46:13: 23° 44′ Due East
- December 15 14:28:30: 33° 34′ Due North
- December 15 20:10:46: 23° 45′ Due West
- December 16 02:28:45: 13° 10′ Due South
- December 16 08:46:45: 23° 46′ Due East
- December 16 14:28:59: 33° 36′ Due North
- December 16 20:11:13: 23° 47′ Due West
- December 17 02:29:14: 13° 12′ Due South
- December 17 08:47:16: 23° 49′ Due East
- December 17 14:29:29: 33° 38′ Due North
- December 17 20:11:41: 23° 50′ Due West
- December 18 02:29:43: 13° 14′ Due South
- December 18 08:47:46: 23° 50′ Due East
- December 18 14:29:58: 33° 40′ Due North
- December 18 20:12:09: 23° 51′ Due West
- Other globe predictions:
- Specific sun elevation predictions
- Sunrise and sunset azimuth and time in Punta Arenas before and after the trip
- Star trails in Punta Arenas before and after the trip
- Celestial Navigation in Punta Arenas before and after the trip
- Zoom in on Faro Bahía Porvenir
- Geomagnetic
- Declination
- Punta Arenas
- Union Glacier Camp
- Inclination
- Punta Arenas
- Union Glacier Camp
- Magnetic field strength
- Punta Arenas
- Union Glacier Camp
- Declination
- Length between lines of longitude
- Punta Arenas
- Antarctica

Prediction graph and Python application from “Melodic Lyrics”:
from astropy.time import Time
from astropy.coordinates import EarthLocation, AltAz, get_sun
from astropy import units as u
import pandas as pd
import numpy as np
import matplotlib.pyplot as plt
import matplotlib.dates as mdates

# Set location for Union Glacier (-79.768056, -83.261667) and elevation 700m
union_glacier = EarthLocation(lat=-79.768056*u.deg, lon=-83.261667*u.deg, height=700*u.m)

# Create a time array for every minute between 2024-12-14 and 2024-12-18
start_time = Time('2024-12-14T00:00')
end_time = Time('2024-12-18T23:59')
delta_minutes = np.arange(0, (end_time - start_time).sec // 60 + 1)  # Total number of minutes
times = start_time + delta_minutes * u.min

# Define the AltAz frame for the observer
altaz_frame = AltAz(obstime=times, location=union_glacier)

# Get the sun's position and convert to AltAz for each time step
sun_altaz = get_sun(times).transform_to(altaz_frame)

# Extract the altitude and create a DataFrame
altitudes = sun_altaz.alt.deg
timestamps = times.iso  # Convert time objects to ISO string format

# Prepare the data
astropy_results = pd.DataFrame({
    'Timestamp': timestamps,
    'Solar Elevation (degrees)': altitudes
})

# Convert the 'Timestamp' column to datetime format for better plotting
astropy_results['Timestamp'] = pd.to_datetime(astropy_results['Timestamp'])

# Create an additional 'Date' column to group by day
astropy_results['Date'] = astropy_results['Timestamp'].dt.date

# Find the maximum and minimum solar elevation for each day
daily_max = astropy_results.groupby('Date')['Solar Elevation (degrees)'].idxmax()
daily_min = astropy_results.groupby('Date')['Solar Elevation (degrees)'].idxmin()

# Get corresponding max and min times and values for each day
max_times = astropy_results.loc[daily_max, 'Timestamp']
max_values = astropy_results.loc[daily_max, 'Solar Elevation (degrees)']
min_times = astropy_results.loc[daily_min, 'Timestamp']
min_values = astropy_results.loc[daily_min, 'Solar Elevation (degrees)']

# Plot the solar elevation over time
plt.figure(figsize=(10, 6))
plt.plot(astropy_results['Timestamp'], astropy_results['Solar Elevation (degrees)'], color='blue', linewidth=0.5, label="Solar Elevation")

# Highlight the daily maximum and minimum points
plt.scatter(max_times, max_values, color='red', label="Daily Max Elevation", zorder=5)
plt.scatter(min_times, min_values, color='green', label="Daily Min Elevation", zorder=5)

# Annotate the daily maximum and minimum values on the plot
for i in range(len(max_times)):
    plt.annotate(f'{max_values.iloc[i]:.2f}°', (max_times.iloc[i], max_values.iloc[i]),
                 textcoords="offset points", xytext=(0,5), ha='center', fontsize=8, color='red')
    plt.annotate(f'{min_values.iloc[i]:.2f}°', (min_times.iloc[i], min_values.iloc[i]),
                 textcoords="offset points", xytext=(0,-10), ha='center', fontsize=8, color='green')

# Set up major and minor ticks for the x-axis
plt.gca().xaxis.set_major_locator(mdates.DayLocator())  # Major ticks every day
plt.gca().xaxis.set_minor_locator(mdates.HourLocator(interval=1))  # Minor ticks every hour
plt.gca().xaxis.set_major_formatter(mdates.DateFormatter('%Y-%m-%d'))  # Format the date labels

# Add labels, title, and grid
plt.title('Solar Elevation Over Time at Union Glacier (Dec 14 - Dec 18, 2024)')
plt.xlabel('Time')
plt.ylabel('Solar Elevation (degrees)')
plt.grid(True, which='both')  # Show both major and minor grid lines
plt.xticks(rotation=45)  # Rotate x-axis labels for better readability
plt.tight_layout()

# Add legend
plt.legend()

# Display the plot
plt.show()